Time Structure Display
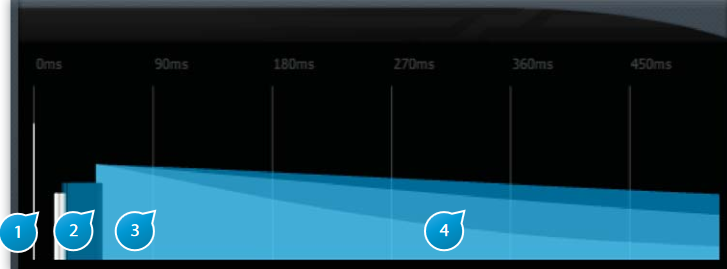
(1) Direct signal
The grey bar at the start of the reverberation pictogram represents the direct sound send at the input of the plug-in. In the time structure of the reverberation, it is the first element that is heard.
(2) Early
Overall representation of the early reflections distribution.
Vertical bars roughly indicate at what time locations (horizontally) and levels (bar height) these early reflections occur.
(3) Cluster
See 12.
(4) Reverb
Shows a graphical representation of the reverberation tail part of the engine. The decay curves of the high, mid and low bands, which are controlled by the decay time settings, are superimposed in different colors and can rapidly be assessed and checked.