Impulse response measurement
Introduction
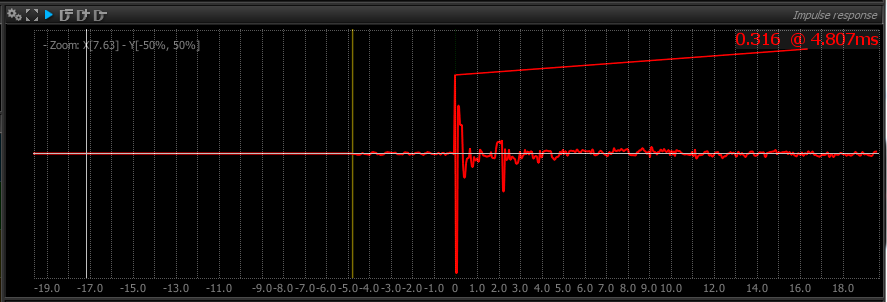
The impulse response of a system is the signal obtained at the output when feeding a click (also termed impulse, spike or Dirac) its input. It is a fundamental tool to describe the time properties of a linear system.
Combined with the transfer function, impulse response measurement is essential in characterizing the acoustics of a studio, concert hall or venue, from which synthetic figures such as reverberation time are derived. Determining the impulse response of an amplifier and loudspeaker in tandem can also serve to assess their performance.
A pass-trough device, or equivalently, a completely dead space such as an anechoic chamber exhibit a unit impulse response, whose value at zero time is gain, and is zero at all other instants.
Analyze / freeze
The  button toggles the impulse response real-time update on and off.
Delay Set
The  delay Set button set value of the peak time location to the delay value currently set for microphone channels in the Live IO Introduction panel.
If Real Time curve is disable, the Max value of the selected snapshot is used.
Delay add
The  delay add button adds value of the peak time location to the delay value currently set for microphone channels in the Live IO Introduction panel.
If Real Time curve is disable, the Max value of the selected snapshot is used.
Delay subtract
The  delay subtract button subtracts the peak value to the microphone channels delay.
If Real Time curve is disable, the Max value of the selected snapshot is used.
The impulse response is closely tied to the transfer function, in that they are both related to another by a Fourier transform.
For practical aspects, FLUX:: Analyzer employs two distinct analysis engines to compute the impulse response and transfer function, as this allows to use separate settings for the two, which is often necessary in practice.
General procedure
Impulse response (IR) measurement requires that sufficient samples be accumulated before the actual computation is ready, depending on the values of the Max Length and Time averaging Time averaging settings. The user interface displays a message indicating the remaining time before the display is ready, whenever the related settings are changed or the reset button is pressed.
Because the software cannot detect whenever you make changes to the analyzed system, you need to press the Reset button in the setup or wait for the display to stabilize before reading the display.
Once your test setup is ready, press the ‘Reset’ button and wait for the display showing remaining time to disappear, at which point the IR display is ready. When a sufficient amount of samples has been accumulated, IR computation goes on as long as the ‘Run’ button is active, and is updated with new incoming samples.
Make sure the actual impulse response is shorter than the maximum specified time, otherwise mild to severe time-aliasing will occur, and the measurement will not be reliable.
A good rule of thumb is to set the Max length parameter to twice that of the estimated RT60 of the room.
If in doubt, raise the Max length setting until the impulse response curve does not change, and check the tail of the curve does indeed fall to zero.
Time averaging
The time averaging function computes the mean of several IR measurements over time, which is very useful to filter out noise and other artifacts. It is enabled by default as this gives better display stability and measurement robustness, however averaging also slows down the reactivity of the display to incoming variations, so you can disable it if needed.
When IR averaging is enabled, a message is shown giving the number of currently computed impulse responses versus averaging length. The display switches to show the mean confidence percentage when ready.
Main setup
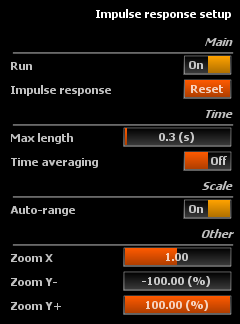
Impulse response setup options
Run
Toggles impulse response live update on and off. Default is on. You can temporarily freeze the impulse response with this button, to examine it in detail at your leisure, without worrying about changing external conditions.
Disabling ‘Run’ is equivalent to freezing the measurement, and leaves the averaging buffer as is.
Reset
Resets the impulse response computation, including the averaging buffer.
If you are using a lengthy averaging setting and have just changed your setup, you can reset the entire impulse response to immediately forget previous measurements .
Max length
Sets the maximum length of the impulse response in seconds. If the reverberation time in your room exceeds this value, time-aliasing will occur, meaning that the impulse response computation will be incorrect and some of the reverberation tail might end up at the start of the display. The default value is 0.3s.
Increasing this value not only requires more processing power, it also increases the time needed to wait for the display to be updated, as the calculations involved need a greater amount of incoming audio samples to be processed.
Combining time averaging and a long length setting mean you’ll have to wait 30 seconds or so for the display to stabilize, so you should really do this if you need to or do not mind waiting.
Time averaging
Accumulates several impulse response measurements and averages them before display. This allows for more precise measurements and lessens the effect of spurious acoustic noise interfering with the measurement, but it also means having to wait longer for the measurement to be ready.
Scale
AutoRange
Toggles auto-scaling the vertical axis to the effective range of the impulse response data in the current timeframe. It functions as an automatic zoom alongside the vertical axis, which can provide useful for hands-free operation.
Other
Zoom
Zoom X
Adjusts the horizontal axis zoom factor, which can also be changed by clicking inside the impulse response display itself and rotating the mouse center wheel up and down (scroll in / out), if your mouse has this feature.
Zoom Y-/+
Adjusts the vertical axis zoom factor.