Header Section
Main toolbar
Main Setup
This is where most of the app preferences are located. The main setup menu has its own documentation section Main setup.
UI Setup
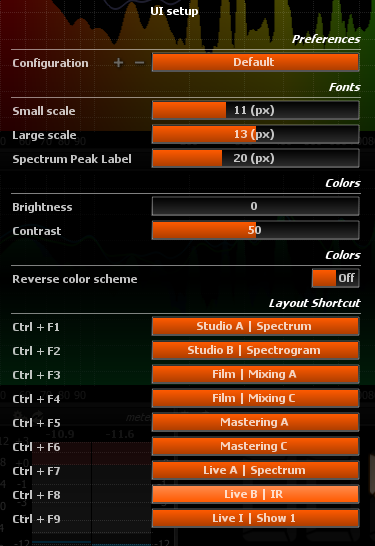
| Configuration | Saves / restores a complete user defined configuration. |
| Fonts: Small Scale | Sets the size of the smallest font used for drawing the grid labels. |
| Fonts: Large Scale | Sets the size of the largest font used for drawing the grid labels. |
| Fonts: Spectrum Peak Label | Sets the size of the font used for the Spectrum peak label. |
| Brightness | Adjusts global user interface brightness. |
| Contrast | Adjusts global user interface contrast. |
| Reverse color scheme | When engaged, the user interface color scheme switches from white/grey on black to black/grey on white, for improved readability in an outdoor environment. |
| Layout Shortcuts | This list allows you to set up to nine shortcuts for direct access to your most frequently used layouts. |
IO Configuration Setup
The IO setup allows to access to the selection and option of the audio interface, as well as to the routing preferences. The IO setup menu has its own documentation section IO Configuration.
Hold info text
When this button is disengaged, textual information overlays displayed above curves are held until the button is engaged again. This allows you to check a particular value precisely, such as an amplitude, gain, or phase at a particular frequency determined by the mouse cursor position when the switch was engaged. The most convenient to use this feature is to use the corresponding keyboard shortcut (F6).
Full-screen mode
Toggles full-screen mode on and off, to maximize screen real estate by masking the task bar (Windows) or Dock (MacOS) if desired.
Close
Exits the application.
Help / about
Displays the application credits, FLUX:: Analyzer software version number, available options with the current license, as well as a table summarizing assigned keyboard shortcuts.
Left toolbar
Audio source
Audio source allows you to select which source to use as input. Depending on your current configuration and settings, this will include:
- Available SampleGrabber instance(s), either local or remote.
- Available hardware device(s), if one or several sound cards are present on the host system, and the corresponding device has been selected in the Hardware IO configuration dialog.
Layout mode
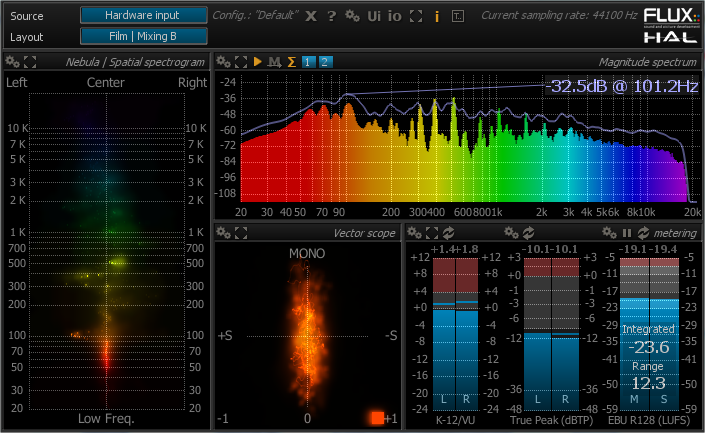
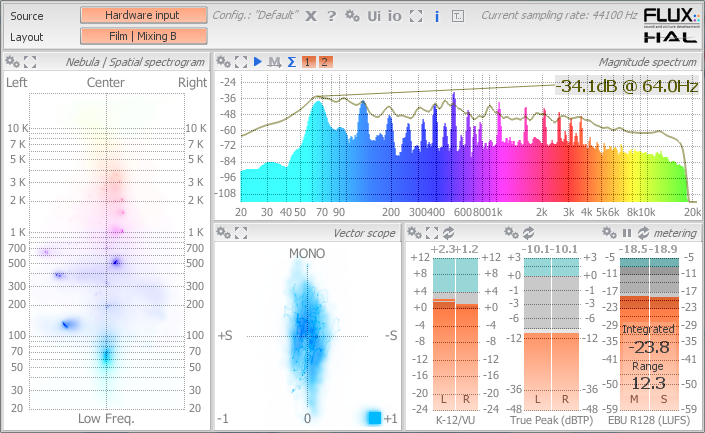
FLUX:: Analyzer offers a number of user interface layouts designed and named according to typical tasks:
The layouts are grouped into categories, as described below.
| Studio | For recording and mastering studio applications, these layouts allow simultaneous monitoring of the spectrum amplitude and spatial distribution, program level and phase. |
| Film mixing | Provide an overview of the signal amplitude spectrum, phase and levels. Film C & D provide Stereo Vector Scope + phase in addition. |
| Mastering | Special emphasis is put on controlling program level, spectral equilibrium and spatial image. These layouts all offer a Nebula / Spatial Spectrogram, a Vector/Surround Scope, Spectrum Amplitude and Level Meters, in different size combinations. These layouts provide the elements needed by the live sound engineer when performing speaker array calibration tasks, namely delay finder, level meter, transfer function magnitude, phase and coherence spectra, impulse response, and snapshot facilities. |
| Live - Show | These layouts are intended for use by a live sound engineer during the course of a show, allowing for constant monitoring of the principal level and spectral indicators of the FOH mix. |
| Metering statistics | Overview of all metering data at a glance. |
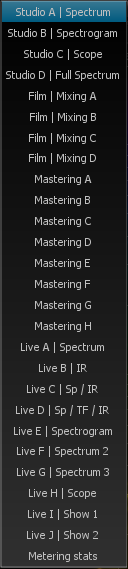
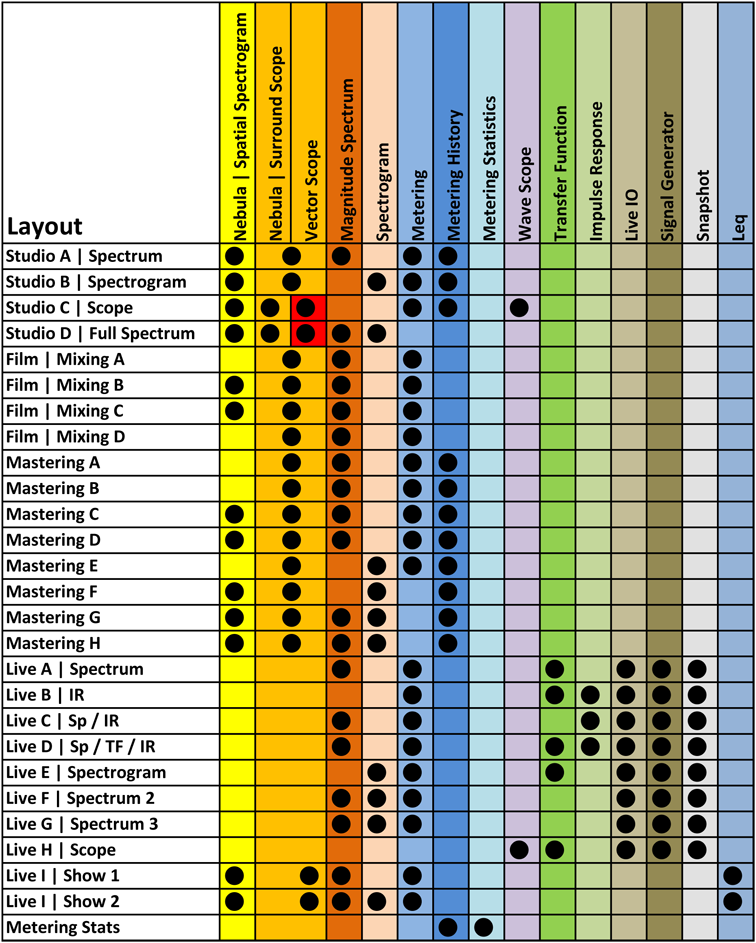
Some layouts might not be available in your FLUX:: Analyzer edition.
Smoothing mode
Switches between Window (the default) and various per-octave smoothing types.
When Window type is selected, a sliding window average of adjustable width is applied to the curve, which results in more or less frequency detail being removed, depending on the Smoothing detail setting.
When any of the Octave types are selected, the average of the spectrum over the corresponding ISO bands is displayed, as series of horizontal bars. The following series are available:
- Octave
- 2/3 octave
- 1/2 octave
- 1/3 octave
- 1/6 octave
- 1/12 octave
Smoothing detail
Controls the amount of frequency detail of the smoothed curve, when using window smoothing. The value roughly corresponds to the maximum number of valleys and peaks that can stand out the smoothed curve. A low value lets the global tendency of the amplitude spectrum pass through, while values above 20 or so preserve more detail such as harmonics and sharp equalizer cuts and boosts. Default is 3.
This curves acts as a kind of zoom-out control, as it shows the global frequency content of the signal, leaving out details such as harmonic peaks and variations imputable to transient and noise components. Typical uses for this curve is to monitor the global frequency balance of a mix and to visualize the influence of broad equalizer corrections on the mix.
Curve display
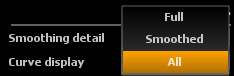
Toggles between the following curve display modes:
- Full: main curve only (no smoothing).
- Smoothed: smoothed curve only.
- All: both unsmoothed and smoothed curves.
Selecting one of the first two modes is recommended to avoid display clutter when comparing several channels and/or snapshots.
Max curve
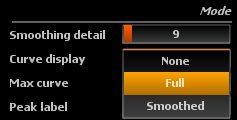
The max curve employs much longer release time compared to the main curve, and as such registers short peaks much more easily.
The max curve setting controls its visibility and whether smoothing is applied:
- None: curve not displayed.
- Full: visible, unsmoothed.
- Smoothed: visible, smoothed.
The max curve is never displayed for snapshots, as it would be the same as the main curve, since this type of curve does not evolve in time.
Peak type
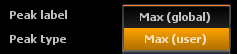
This setting controls the manner in which spectrum magnitude peaks are computed:
- Max (global): compute a global maximum over the entire spectrum range.
- Max (user): compute the maximum across a user defined portion of the spectrum set in the Peak range.
Peak label
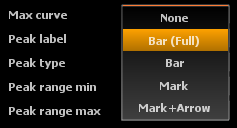
Determines the appearance of the peak display:
- None: peaks are not shown.
- Bar (Full): vertical bar at current peak located at current frequency.
- Bar: vertical bar from base to peak value.
- Mark: text box indicating peak value, in dB, and frequency (Hz) at peak location.
- Mark + Arrow: same as above, with text at the top of the display and arrow pointing at peak location. This is the most precise indication, but takes up more space.
Peak range
Used in combination with the Max (user) Peak type setting, this defines the minimum and maximum frequencies to take into account when computing the peak.