Spectrogram
Usage
The spectrogram is a two-dimensional view of the evolution of the signal’s spectrum over time, i.e. a frequency (Y-axis) versus time (X-axis) plot (or the invert, depending on the direction setting), with the magnitude modulating the color and intensity of the pixels.
A spectrogram can be computed using the STFT (short-term Fourier transform) as well as other means. It serves as a useful tool to get a global picture of how the frequency content of a signal changes over a time, and eases identification of its structure. Broadband noise appears as background, a pure tone as a horizontal line, and a transient as a vertical line.
Harmonic content appears as horizontal groups of parallel lines and vertical bars respectively, etc.
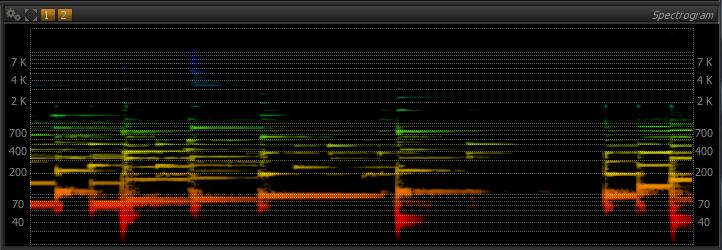
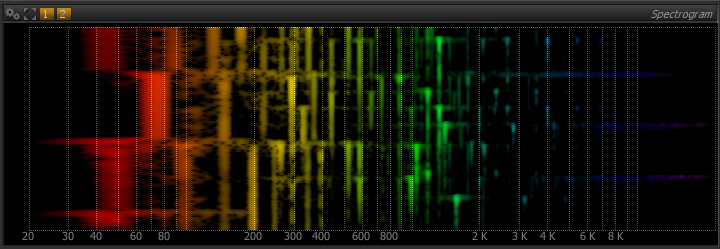
Example spectrogram view
Setup
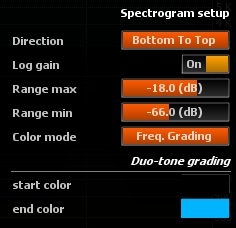
Spectrogram setup
Direction

Defines the scrolling direction of the spectrogram.
Log Gain
Toggles logarithmic scaling of the magnitude spectrum on and off.
Default is on.
When enabled, the magnitude at a given time-frequency point is applied a logarithmic scaling before being converted to a pixel value. This has the effect of compressing the dynamic range, and makes low energy components stand out more, but also decreases the contrast of the display.
Threshold
Threshold - Range Max
Sets the maximum amplitude spectrum value to be displayed.
Threshold - Range Min
Sets the minimum amplitude spectrum value to be displayed.
Color Mode
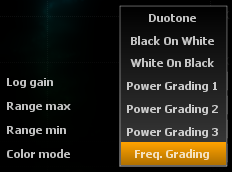
Duotone
In this color mode, the amplitude of a time-frequency point is mapped to a pixel using a two-color palette, set using start/end colors.
Black On White
In this color mode, the amplitude of a time-frequency point is mapped to a pixel using a Black & White color palette with White as background.
White On Black
In this color mode, the amplitude of a time-frequency point is mapped to a pixel using a Black & White color palette with Black as background.
Power grading 1, 2, 3, 4, 5
In this color mode, the amplitude of a time-frequency point is mapped to a pixel using different predefined color palette.
Frequency grading
In this color mode, the amplitude of a time-frequency point determines the intensity of the corresponding pixel, whose color varies according to frequency.
Duo-tone grading start/end colors
Sets the color to use for minimum and maximum amplitude components respectively, when color mode is set to Duotone.