Metering History
Usage
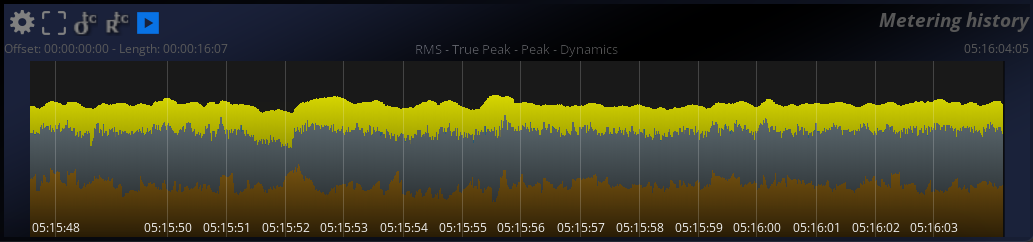
The metering history panel stores and displays the evolution of meters over time, with a red vertical bar indicating the current time. Start and end time-points of the period are displayed left and right in time-code format.
Selecting which meters are to be included in the display is done by clicking the corresponding buttons in the setup.
Timecode offset
Clicking the  defines the current time as the Timecode offset.
Timecode offset reset
Clicking the  button resets the Timecode offset to zero. Absolute and relative Timecode will then be the same.
Play
Clicking the  toggles history recording on and off. Metering values are discarded when off.
The metering history relies on the same settings as those defined in the various meters. However, when multiple meter values are displayed simultaneously, the display range of the history is adapted to encompass the display ranges of the meters.
Keep in mind different meters can be set to different zero reference points when comparing meter history curves.
Settings
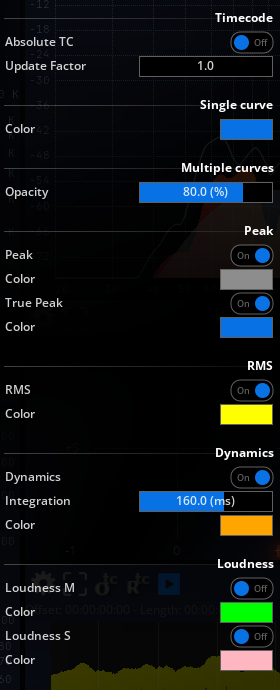
TimeCode
| Name | Description |
|---|---|
| Absolute Timecode | Switches between absolute and relative timecode formats. |
| Update Factor | Divides the History refresh interval; allowing to increase the history time period. |
Single curve
| Name | Description |
|---|---|
| Color | Sets the color to use when only a single curve is selected for display. |
Multiple curves
| Name | Description |
|---|---|
| Opacity | Set the amount of opacity for the curves. |
Peak
| Name | Description |
|---|---|
| Peak | These settings allow to specify whether Peak and/or TruePeak curves should be displayed, as well the color to use when drawing them. |
RMS
| Name | Description |
|---|---|
| RMS | Toggle RMS curve display on and off, and specify the color to use for drawing. |
Dynamics
The dynamics is the current dynamic range of the signal, that is the ratio of the peaks with respect to the average, i.e. the crest factor of the signal.
| Name | Description |
|---|---|
| Dynamics | Toggles dynamics curve display on and off. |
| Integration | Set the integration time, in milliseconds. |
| Color | Specify the color to use for drawing the curve. 1 |
Loudness
| Name | Description |
|---|---|
| Loudness | These settings allow to specify whether Short-term and/or Momentary EBU R128 Loudness curves should be displayed, as well the color to use when drawing them. |
Percussive content such as drums or rhythm guitar exhibits high dynamics, as opposed to sustained sounds such as strings and synthesizer pads.↩︎