Spectrogram
Usage
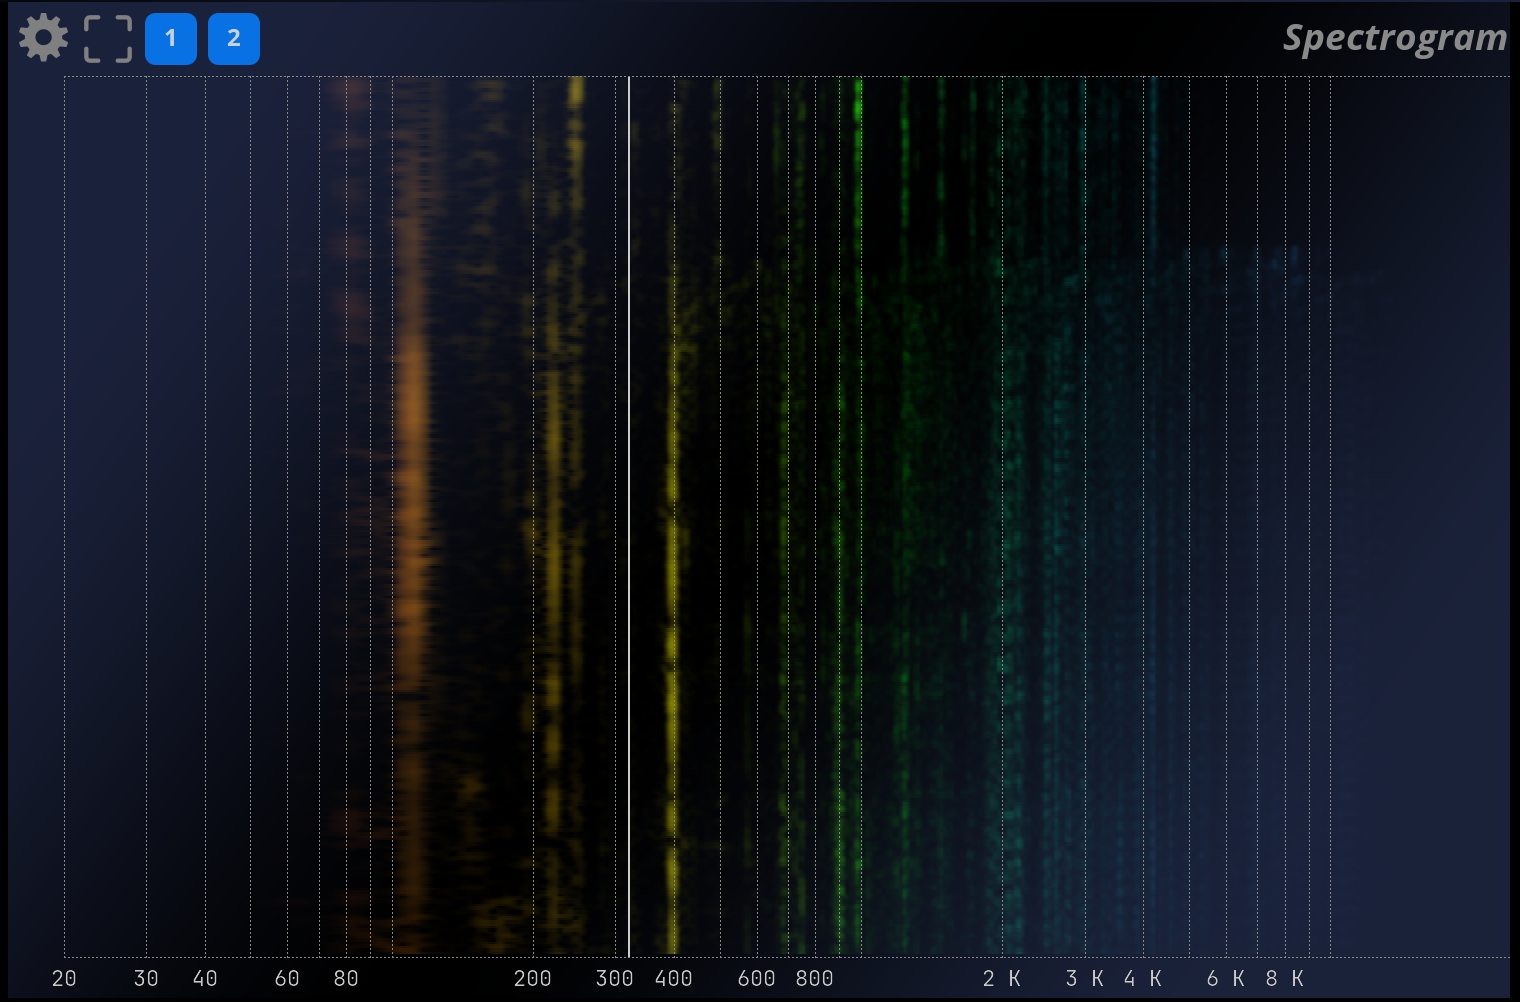
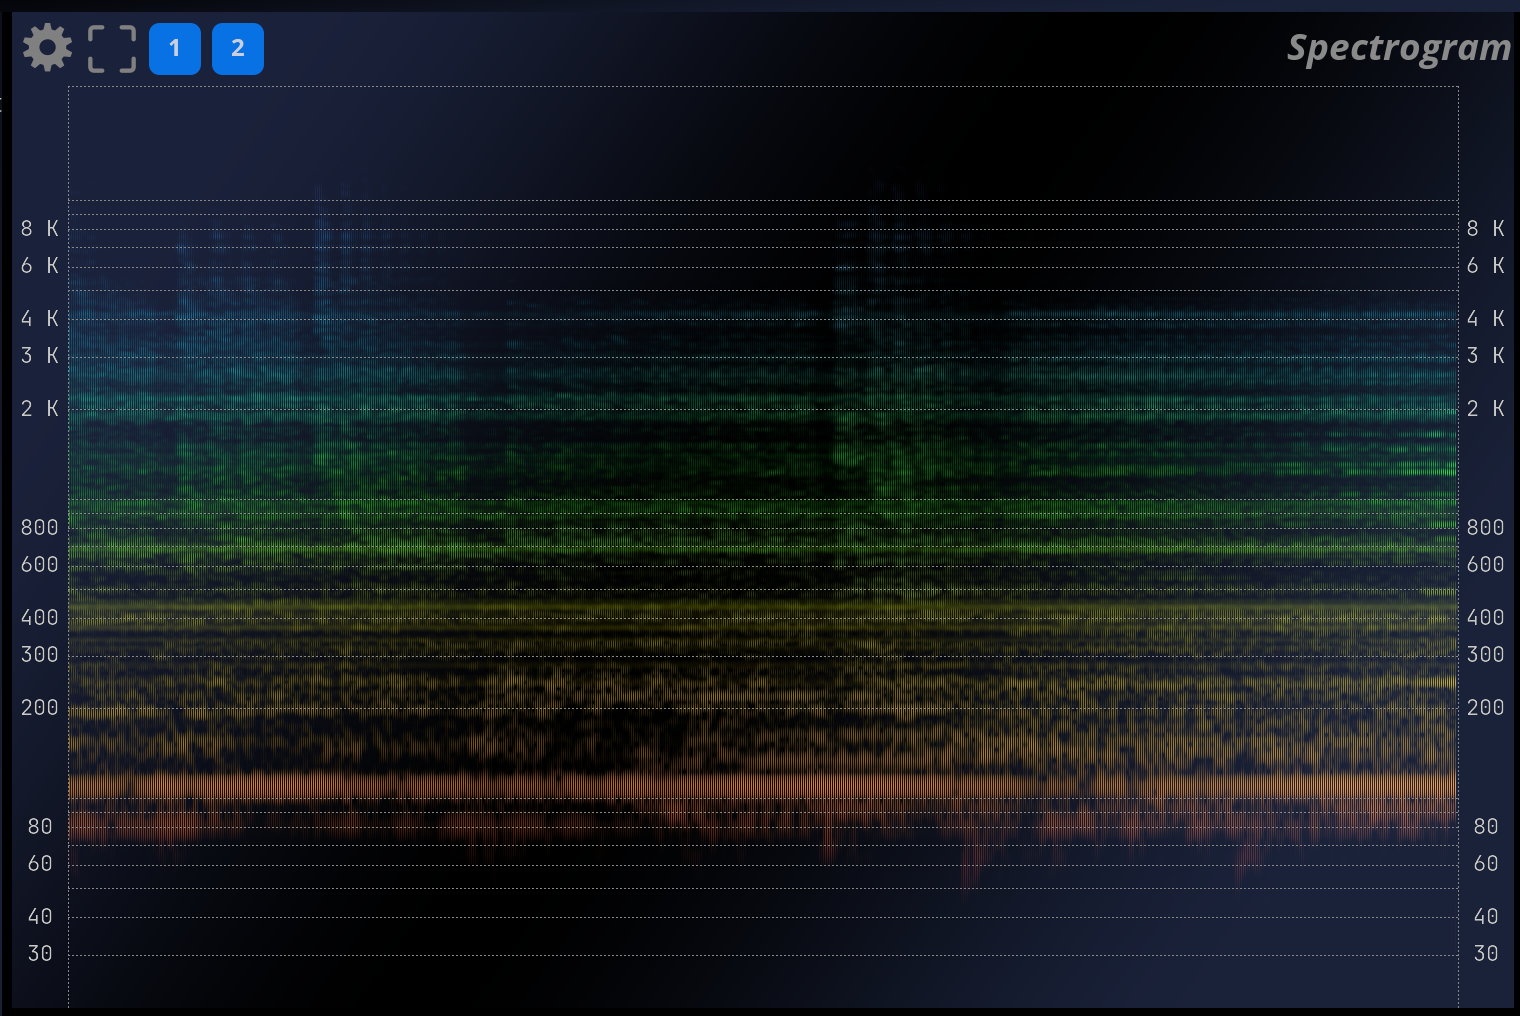
The spectrogram is a two-dimensional view of the evolution of the signal’s spectrum over time, i.e. a frequency (Y-axis) versus time (X-axis) plot (or the invert, depending on the direction setting), with the magnitude modulating the color and intensity of the pixels.
A spectrogram can be computed using the STFT (short-term Fourier transform) as well as other means. It serves as a useful tool to get a global picture of how the frequency content of a signal changes over time, and eases identification of its structure. Broadband noise appears as background, a pure tone as a horizontal line, and a transient as a vertical line.
Harmonic content appears as horizontal groups of parallel lines and vertical bars respectively, etc.
Settings
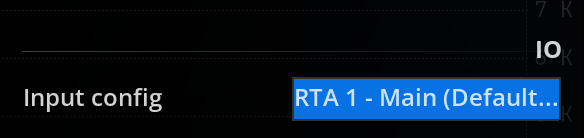
IO
| Name | Description |
|---|---|
| Input config | Define the input configuration analyzed by this scope. |
Mode
| Name | Description |
|---|---|
| Direction | 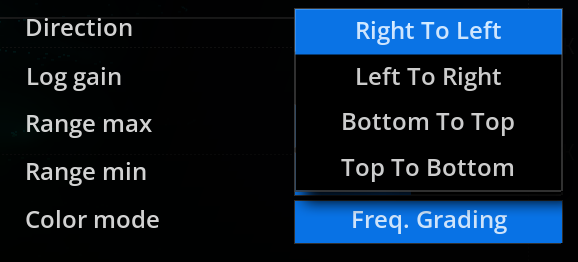 Defines the scrolling direction of the spectrogram. Defines the scrolling direction of the spectrogram. |

Range
| Name | Description |
|---|---|
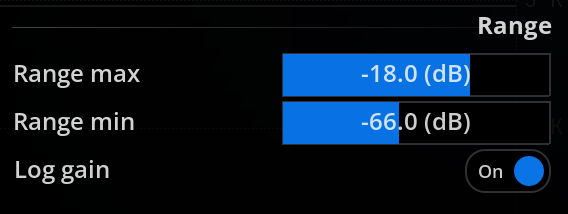
| Range Max | Sets the maximum amplitude spectrum value to be displayed. |
| Range Min | Sets the minimum amplitude spectrum value to be displayed. |
| Log Gain | Toggles logarithmic scaling of the magnitude spectrum on and off. Default is on. When enabled, the magnitude at a given time-frequency point is applied a logarithmic scaling before being converted to a pixel value. This has the effect of compressing the dynamic range, and makes low energy components stand out more, but it also decreases the contrast of the display. |
Colors
| Name | Description |
|---|---|
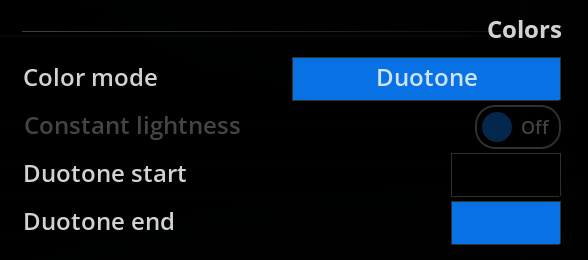
| Color Mode | 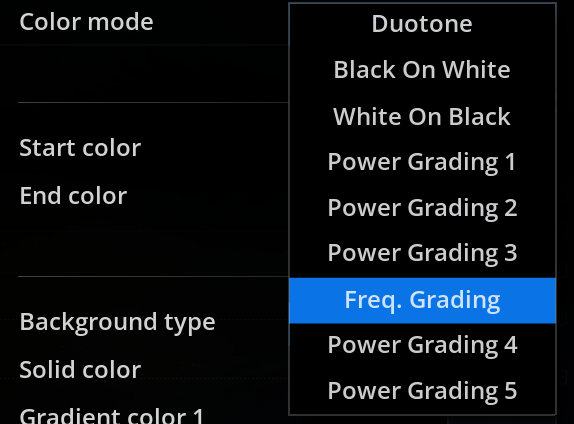 Duotone: In this color mode, the amplitude of a time-frequency point is mapped to a pixel using a two-color palette, set using start/end colors. Black On White: In this color mode, the amplitude of a time-frequency point is mapped to a pixel using a Black and White color palette with White as background. White On Black: In this color mode, the amplitude of a time-frequency point is mapped to a pixel using a Black and White color palette with Black as background. Power grading 1, 2, 3, 4, 5: In this color mode, the amplitude of a time-frequency point is mapped to a pixel using a different predefined color palette. Frequency grading: In this color mode, the amplitude of a time-frequency point determines the intensity of the corresponding pixel, whose color varies according to frequency. Duotone: In this color mode, the amplitude of a time-frequency point is mapped to a pixel using a two-color palette, set using start/end colors. Black On White: In this color mode, the amplitude of a time-frequency point is mapped to a pixel using a Black and White color palette with White as background. White On Black: In this color mode, the amplitude of a time-frequency point is mapped to a pixel using a Black and White color palette with Black as background. Power grading 1, 2, 3, 4, 5: In this color mode, the amplitude of a time-frequency point is mapped to a pixel using a different predefined color palette. Frequency grading: In this color mode, the amplitude of a time-frequency point determines the intensity of the corresponding pixel, whose color varies according to frequency. |
| Constant lightness | Toggles constant lightness on and off. This makes the display more legible, but also less colorful. |
| Duotone start | Select the color to use when there is the signal is at amplitude minimal. This field is only available when “Color mode” is set to “Duotone” |
| Duotone end | Select the color to use when there is the signal is at amplitude maximal. This field is only available when “Color mode” is set to “Duotone” |
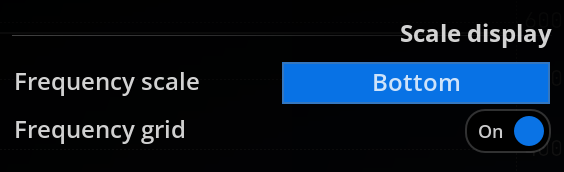
Scaled display
| Name | Description |
|---|---|
| Frequency scale | Select where to display the frequency scale. |
| Frequency grid | Enable or disable the frequency grid. |