Spectrum Analyzer
Presentation
A spectrum analyzer’s global principle and purpose is to transform an incoming signal, which is basically a series of amplitudes taken at successive points in time, into a series of values versus frequency. Transforming an audio signal onto a frequency scale is indeed of great interest in a wide range of tasks, especially because it provides a global, perceptually meaningful and precise picture of the audio contents.
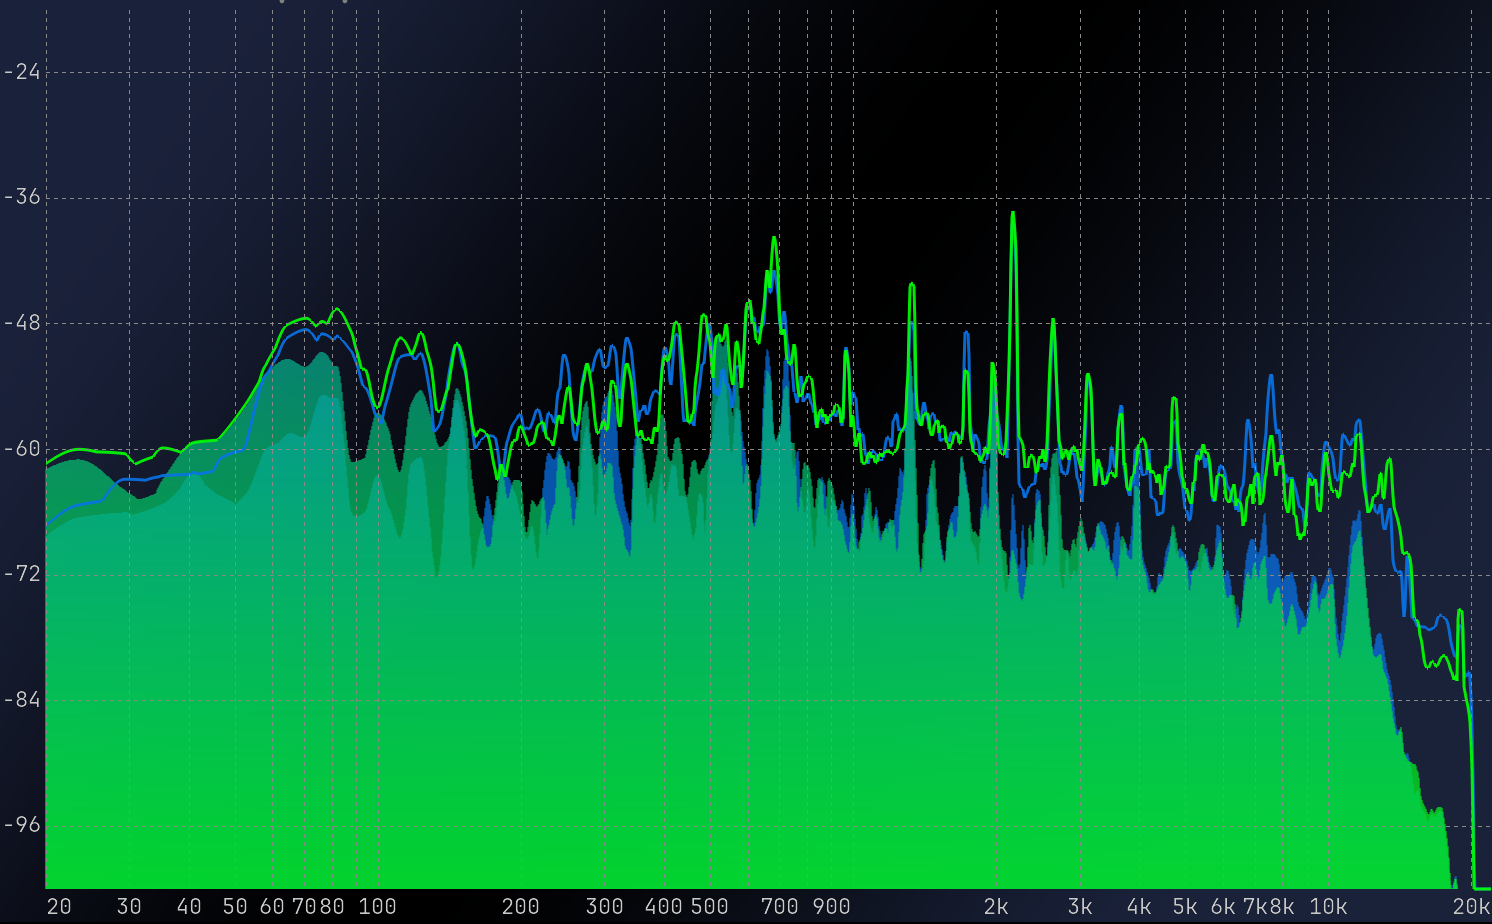
The display represents the so-called magnitude spectrum of the incoming signal, which is a two-dimensional curve of the magnitudes of the signal taken at frequencies ranging from 0 (DC) to half that of the current sampling rate (or Nyquist frequency in signal processing jargon). This is probably the most commonplace and most easily understood spectrum analyzer visualization, and the place where you should start most of the time when you want to inspect the frequency content of your audio material.
Channel Selection and Summing

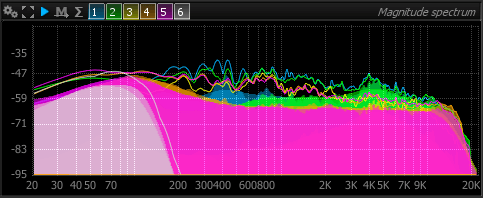
Above the spectrum analyzer, there are special buttons for channel selection:
- Numbers associated with input channels
- A “plus” symbol under each channel number
When an input channel is on, its spectrum is displayed in the spectrum analyzer. When the “plus” button of a channel is on, it feeds its signal to the summation curve. Several channels can be sent to the summation curve.
This means that you can display both the sum or individual channels in the same spectrum analyzer. To remove the sum plot, uncheck all the “plus” signs under the channel numbers.
Settings
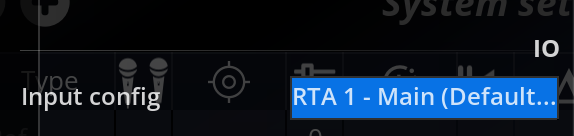
IO
| Name | Description |
|---|---|
| Input config | Define the input configuration analyzed by this scope. |
Range
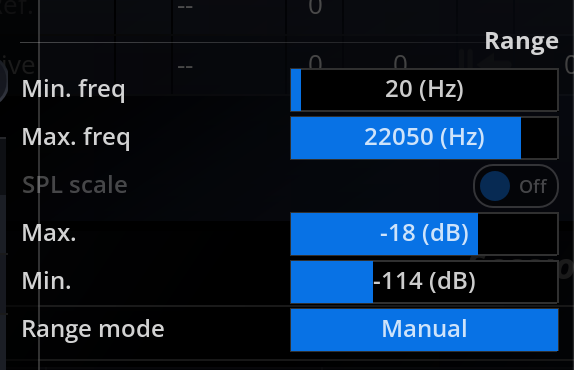
Display range can be switched from a fixed reference interval to one that automatically adjusts to the current range of spectrum magnitude values. The latter is useful as a set and forget setting and works well to display the most vertical detail, at the expense of losing the ability to visually compare the current values to a reference level.
| Name | Description |
|---|---|
| Min. frequency | Minimum frequency to display. Default is 20 Hz. |
| Max. frequency | Maximum frequency to display. Default is 22050 Hz. |
| SPL scale | Display the scale in dB SPL. This field is enabled only if the “Input Config” is set to “All response microphones” |
| dB Min / dB Max | Sets the minimum and maximum magnitude to display, in decibels. This is visible the range of the display that is taken into account when auto-range is off. Default range is -18dB (min) to -114dB (max). |
| Range mode | Default is Manual. -Manuel: uses a fixed range as specified by the above settings. 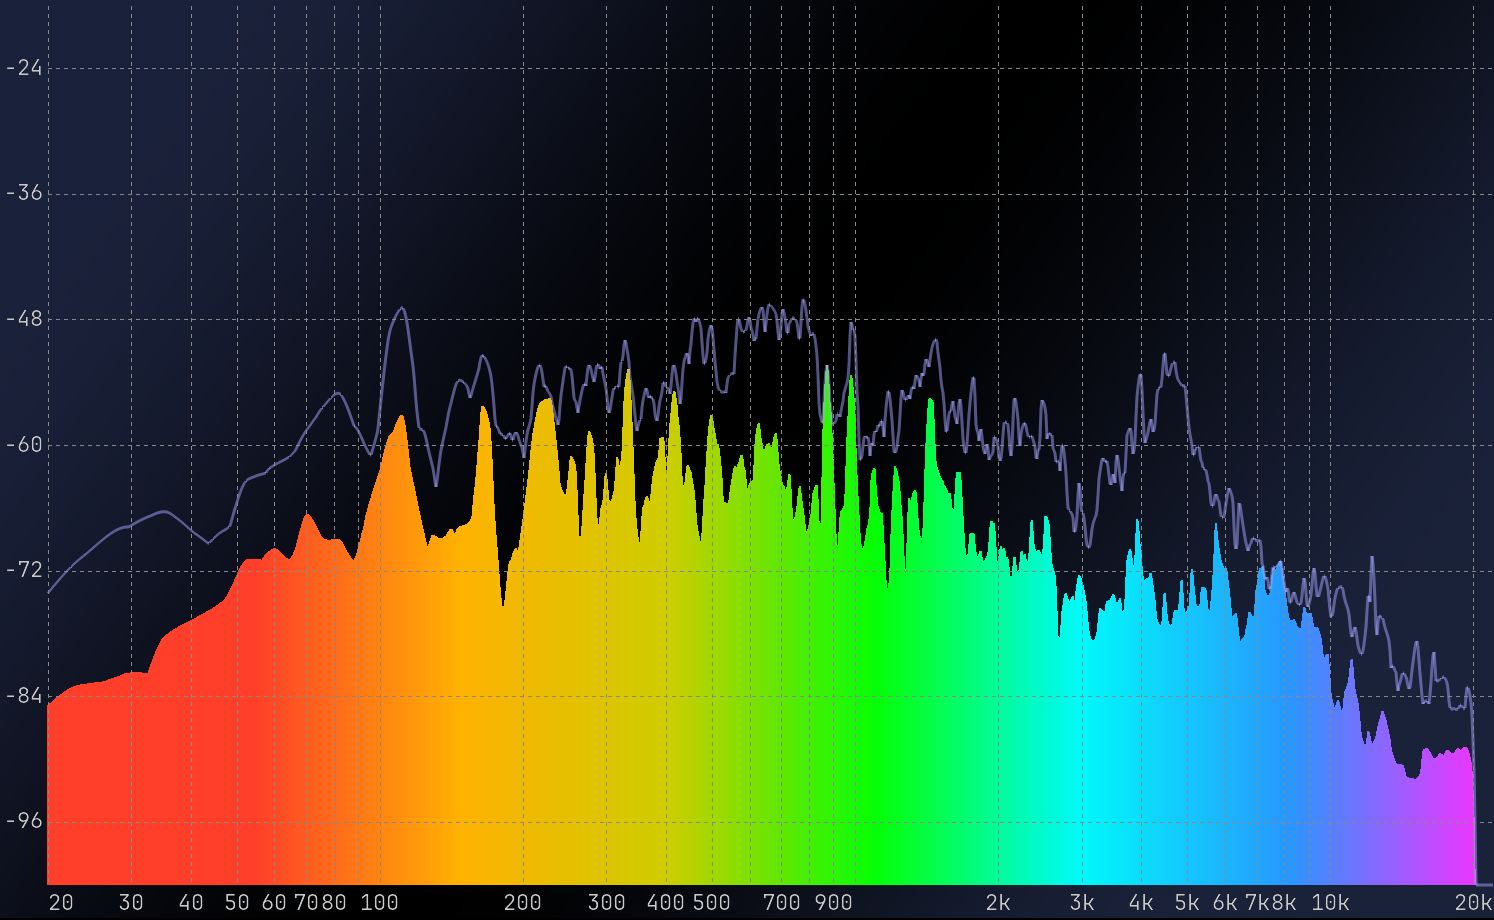 -Auto: When engaged, auto-range continuously adjusts the display to the current range of the data. 1 -Compressed: The range is defined by dB Min/Max values, and the Y-axis is also compressed in lower range. This can bring out peaks and valleys in the spectrum to better visualize resonant frequencies and such. 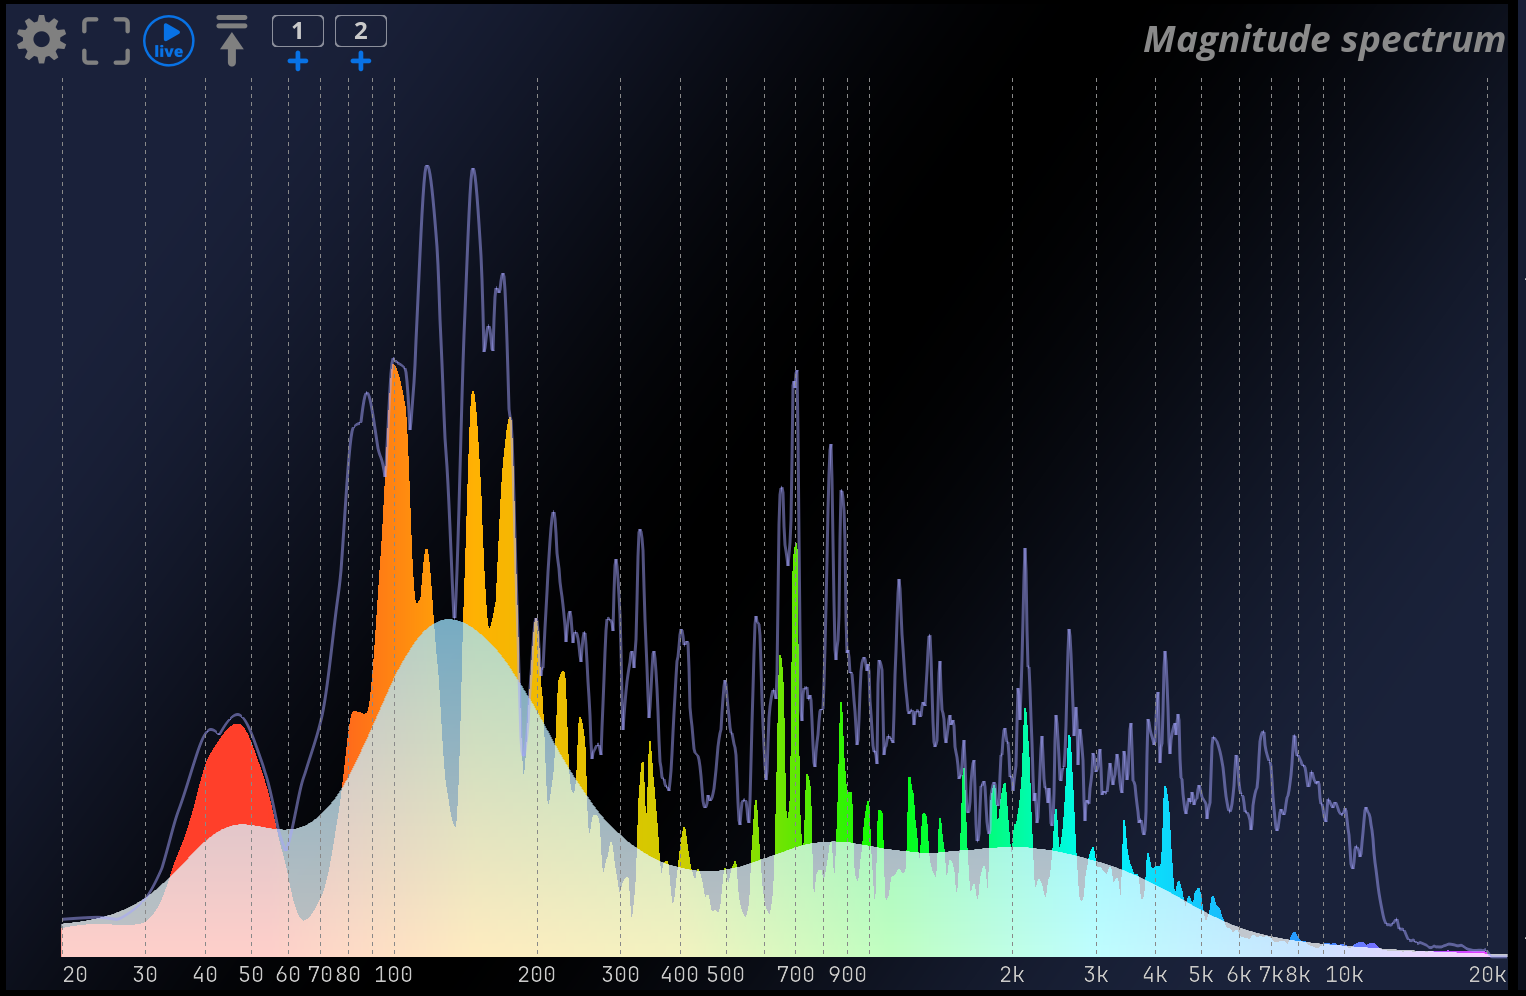 -Compressed / Auto: Combines Compressed and Auto modes |
Ballistics
The ballistics settings control the curve display update speed.
| Name | Description |
|---|---|
| Release time | The release time determines how fast the main curve falls back to zero. Default is 300ms. |
| Max release time | The controls the release time of the optional Max curve, which serves to display the medium-to-long term tendency of the magnitude spectrum. Longer times mean curve maxima/peaks will be seen for a longer period. Default is 50 seconds.2 |

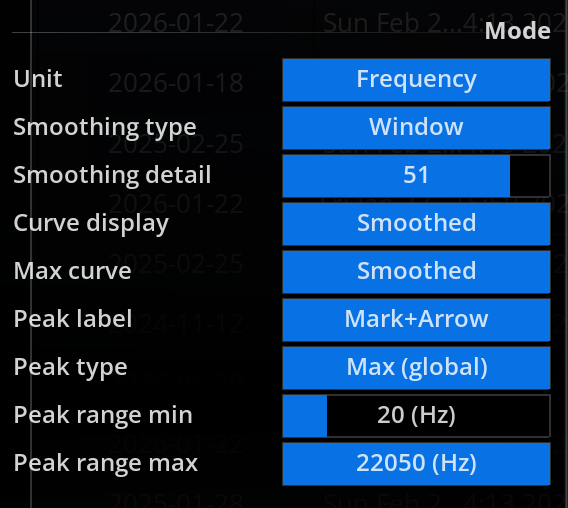
Mode
| Name | Description |
|---|---|
| Smoothing type | Switches between Window (default) and various per-octave smoothing types. When Window type is selected, a sliding window average of adjustable width is applied to the curve, which results in more or less frequency detail being removed, depending on the Smoothing detail setting. When any of the Octave types are selected, the average of the spectrum over the corresponding ISO bands is displayed, as a series of horizontal bars. The following series are available: Octave, 2/3 octave, 1/2 octave, 1/3 octave, 1/6 octave, 1/12 octave. |
| Smoothing detail | Controls the amount of frequency detail of the smoothed curve, when using window smoothing. The value roughly corresponds to the maximum number of valleys and peaks that can stand out the smoothed curve. A low value lets the global tendency of the amplitude spectrum pass through, while values above 20 or so preserve more detail such as harmonics and sharp equalizer cuts and boosts. Default is 3.3 |
| Curve display | 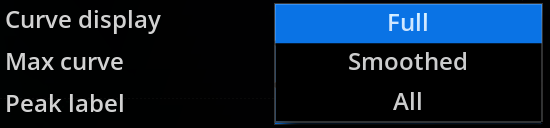 Toggles between the following curve display modes: Full (main curve only, no smoothing), Smoothed (smoothed curve only), All (both raw and smoothed curves).4 Toggles between the following curve display modes: Full (main curve only, no smoothing), Smoothed (smoothed curve only), All (both raw and smoothed curves).4 |
| Max curve | 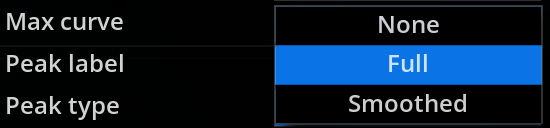 The max curve employs a much longer release time compared to the main curve, and, as such, registers short peaks much more easily. The max curve setting controls its visibility and whether smoothing is applied: None (curve not displayed), Full (visible, raw), Smoothed (visible, smoothed).5 The max curve employs a much longer release time compared to the main curve, and, as such, registers short peaks much more easily. The max curve setting controls its visibility and whether smoothing is applied: None (curve not displayed), Full (visible, raw), Smoothed (visible, smoothed).5 |
| Peak label | 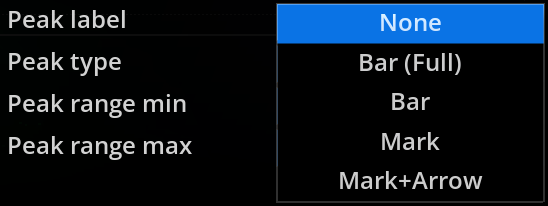 Determines the appearance of the peak display: None (peaks are not shown), Bar (Full) (vertical bar at current peak located at current frequency), Bar (vertical bar from base to peak value), Mark (text box indicating peak value, in dB, and frequency (Hz) at peak location), Mark + Arrow (same as above, with text at the top of the display and arrow pointing at peak location). Determines the appearance of the peak display: None (peaks are not shown), Bar (Full) (vertical bar at current peak located at current frequency), Bar (vertical bar from base to peak value), Mark (text box indicating peak value, in dB, and frequency (Hz) at peak location), Mark + Arrow (same as above, with text at the top of the display and arrow pointing at peak location). |
| Peak type | 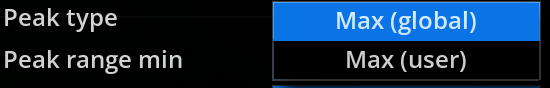 This setting controls the manner in which spectrum magnitude peaks are computed: Max (global) (compute a global maximum over the entire spectrum range), Max (user) (compute the maximum across a user defined portion of the spectrum set in the Peak range). This setting controls the manner in which spectrum magnitude peaks are computed: Max (global) (compute a global maximum over the entire spectrum range), Max (user) (compute the maximum across a user defined portion of the spectrum set in the Peak range). |
| Peak range | Used in combination with the Max (user) Peak type setting, this defines the minimum and maximum frequencies to take into account when computing the peak. |
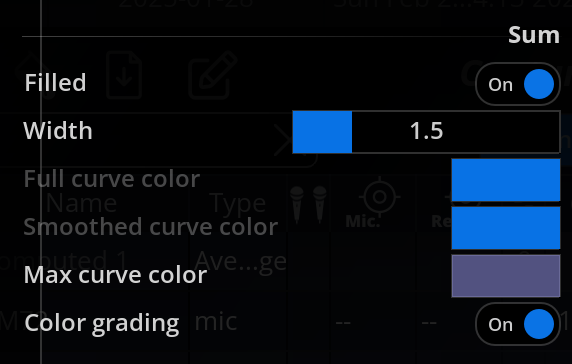
Summation
These settings allow you to modify the appearance of the curves in channel sum mode.
| Name | Description |
|---|---|
| Filled | Toggles whether the main curve is drawn as a solid-color fill or a plain line. Default is on. |
| Width | Thickness of the pen used to draw the curve lines, in pixels. Default is 1.0.6 |
| Full curve color | Color of the pen used to draw the main, full-detail, raw curve. |
| Smoothed curve color | Color of the pen used to draw the smoothed curve. |
| Max curve color | Color of the pen used to draw the max curve. |
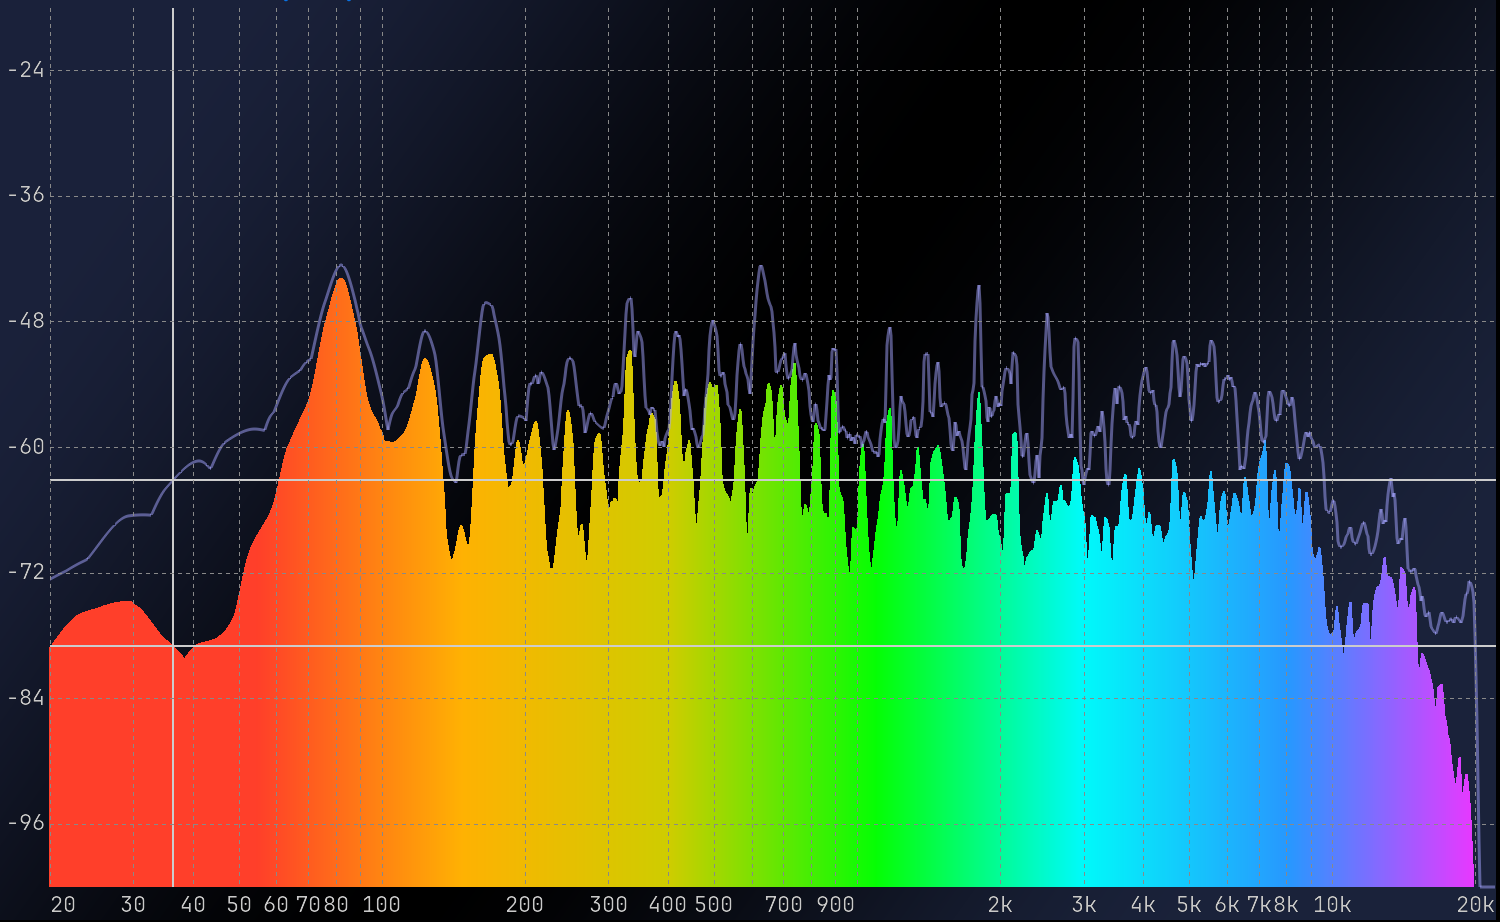
| Color grading | Applies an optional frequency-dependent coloring to the main channel-sum curve. 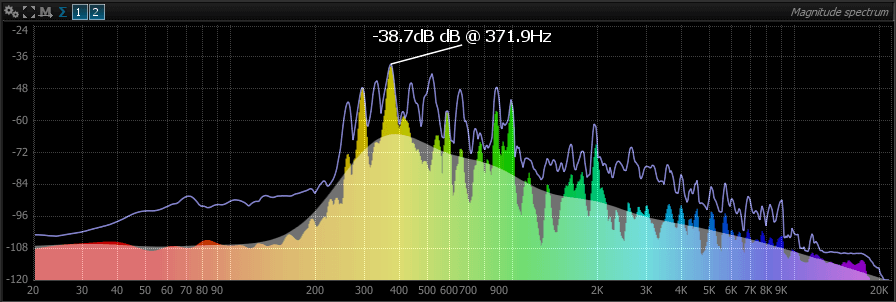 Magnitude spectrum with color grading enabled.7 Magnitude spectrum with color grading enabled.7 |
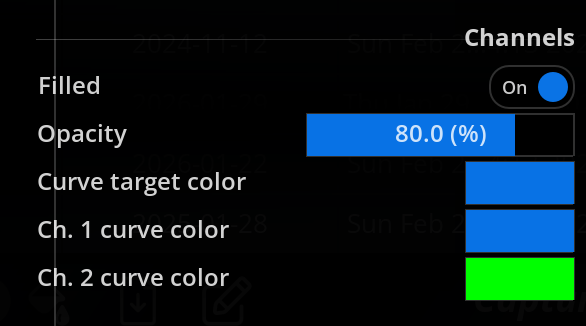
Channels
This group of settings controls the appearance of curves when channel sum mode is disabled. There is one Ch.N curve color setting per channel, so you can fine-tune the color scheme employed if you wish to do so.
| Name | Description |
|---|---|
| Filled | Controls whether channel curves are drawn as a solid color fill or a plain line. |
| Opacity | Controls the opacity of the fill when Filled is enabled. 100% gives a fully opaque fill, lowering this value makes the curve fill more transparent. |
| Channel curve color | This setting controls the color of the curve corresponding to the n |
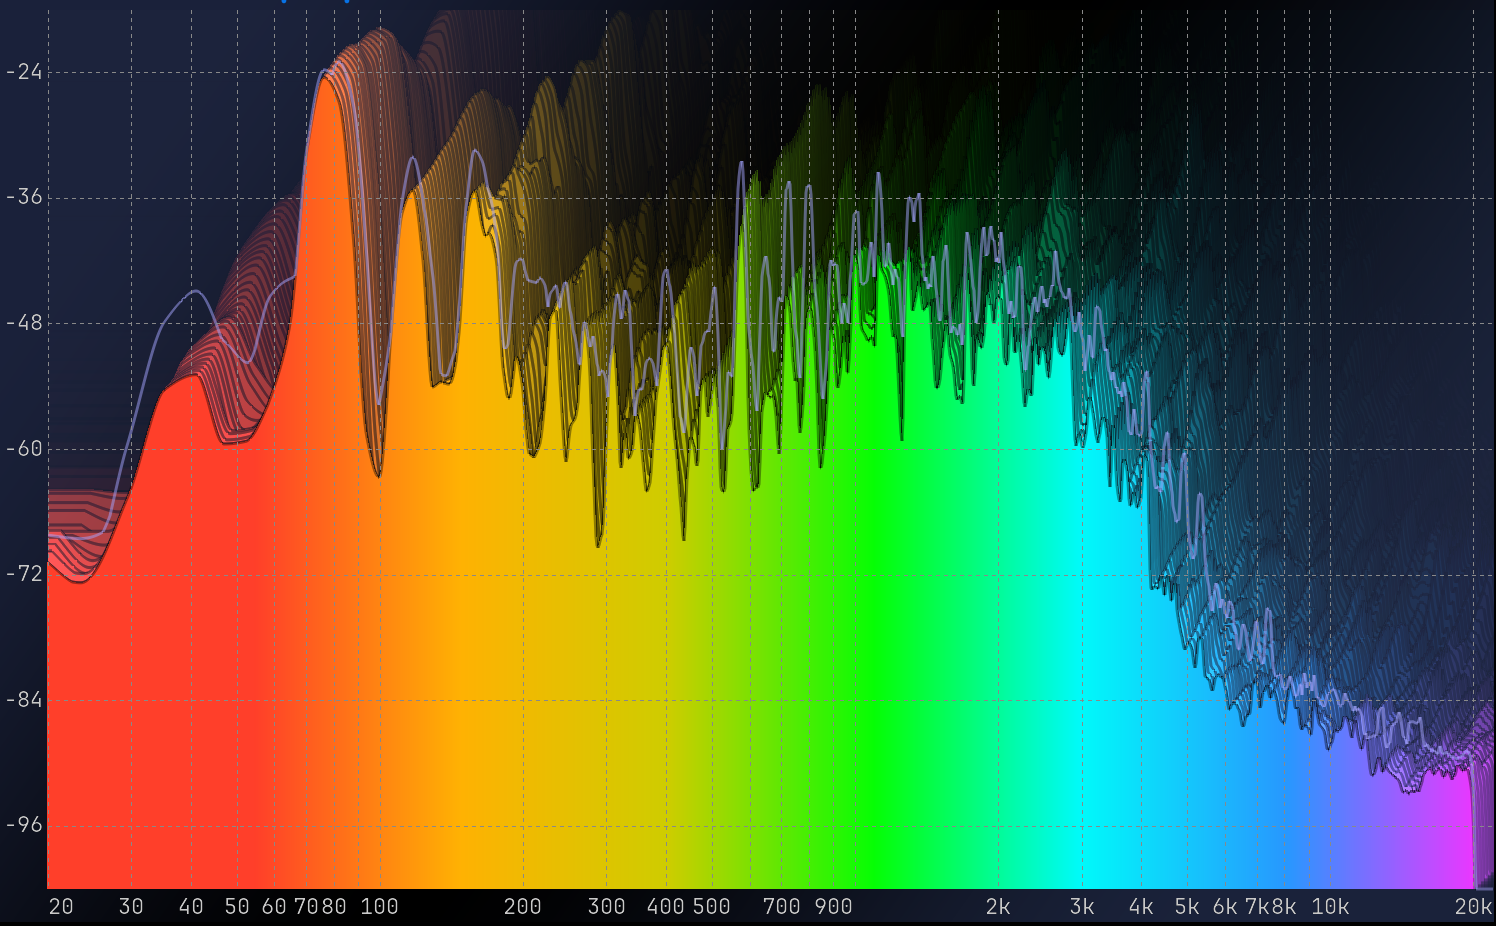
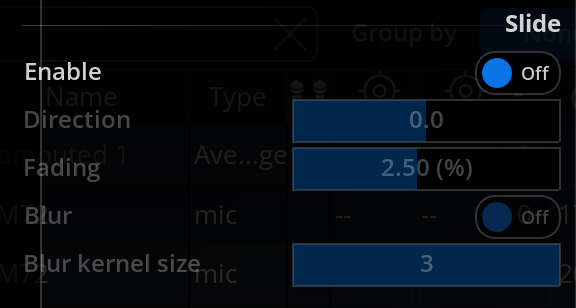
Slide (Real Time waterfall)
| Name | Description |
|---|---|
| Enable | Enable/disable the slide mode. |
| Direction | Define the sliding Direction. From -5 to 5. Default is 0. |
| Fading | Controls display persistence, i.e. the “fade to black” amount for a frame. Lowering this value retains past particles longer, whereas increasing this makes them disappear faster. |
| Blur | Enable / Disable sliding blur. |
| Blur Kernel Size | Controls the radius of the blur effect applied to past particles. Particles are “smeared” more and more as they become older, depending on this setting. Naturally, a bigger value increases the smearing, at the expense of processing power.8 |
Other
| Name | Description |
|---|---|
| Zoom | This setting allows to check and change the current X-axis zoom level. Default is 1.0, which corresponds to the whole frequency spectrum. Zooming with the mouse is the preferred way, as it offers more control. |
| Line anti-alias | Activate the graphical anti-aliasing of the outline of curves. |
| Fill anti-alias | Activate the graphical anti-aliasing of the curves. |
A slight envelope is applied to the auto-range values in order to improve legibility, avoiding the display to follow every minor change. Peaks are always registered however, as these provide valuable information that should not be missed.↩︎
The attack time is zero so the curve display reacts instantaneously to a rising amplitude.↩︎
This curve acts as a kind of zoom-out control, as it shows the global frequency content of the signal, leaving out details such as harmonic peaks and variations imputable to transient and noise components. Typical uses for this curve are to monitor the global frequency balance of a mix and to visualize the influence of broad equalizer corrections on the mix.↩︎
Selecting one of the first two modes is recommended to avoid display clutter when comparing several channels and/or captures.↩︎
The max curve is never displayed for captures, as it would be the same as the main curve, since this type of curve does not evolve in time.↩︎
This setting also affects individual curves when channel sum mode is disabled.↩︎
When enabled, any of the above fixed color settings are overridden.↩︎
Choosing the value for this setting is really a matter of taste, although please keep in mind values that above 5 will require a sufficiently powerful graphics card in order to maintain a responsive display.↩︎