Equalization (EQ) and Auto-EQ
Introduction
MiRA features a comprehensive equalization system that allows precise frequency response correction simulation of measured audio systems. The EQ can be applied to individual captures or computed curves, providing real-time visualization of the equalized transfer function alongside the original measurement.
This equalization system is not a real-time EQ processor, it is a tool to simulate the effect of an EQ on a measured system. It is meant to be used in conjunction with an external EQ processor, to which the EQ settings can be exported.
In order to improve the workflow and make it as smooth as possible, MiRA also provides an Auto-EQ feature that automatically generates optimal EQ settings. This function employs advanced optimization algorithms to compute the parameters of a multi-band parametric equalizer that compensates for irregularities in the measured response, in an efficient and quick manner.
The EQ system supports up to 16 parametric bands with multiple filter types, configurable slopes, and flexible export capabilities for integration with external processors. New EQs are initialized with 6 active bands.
EQ and Auto-EQ are available in the Live and Ultimate version of MiRA only.
EQ Integration in MiRA
Capture-based EQ
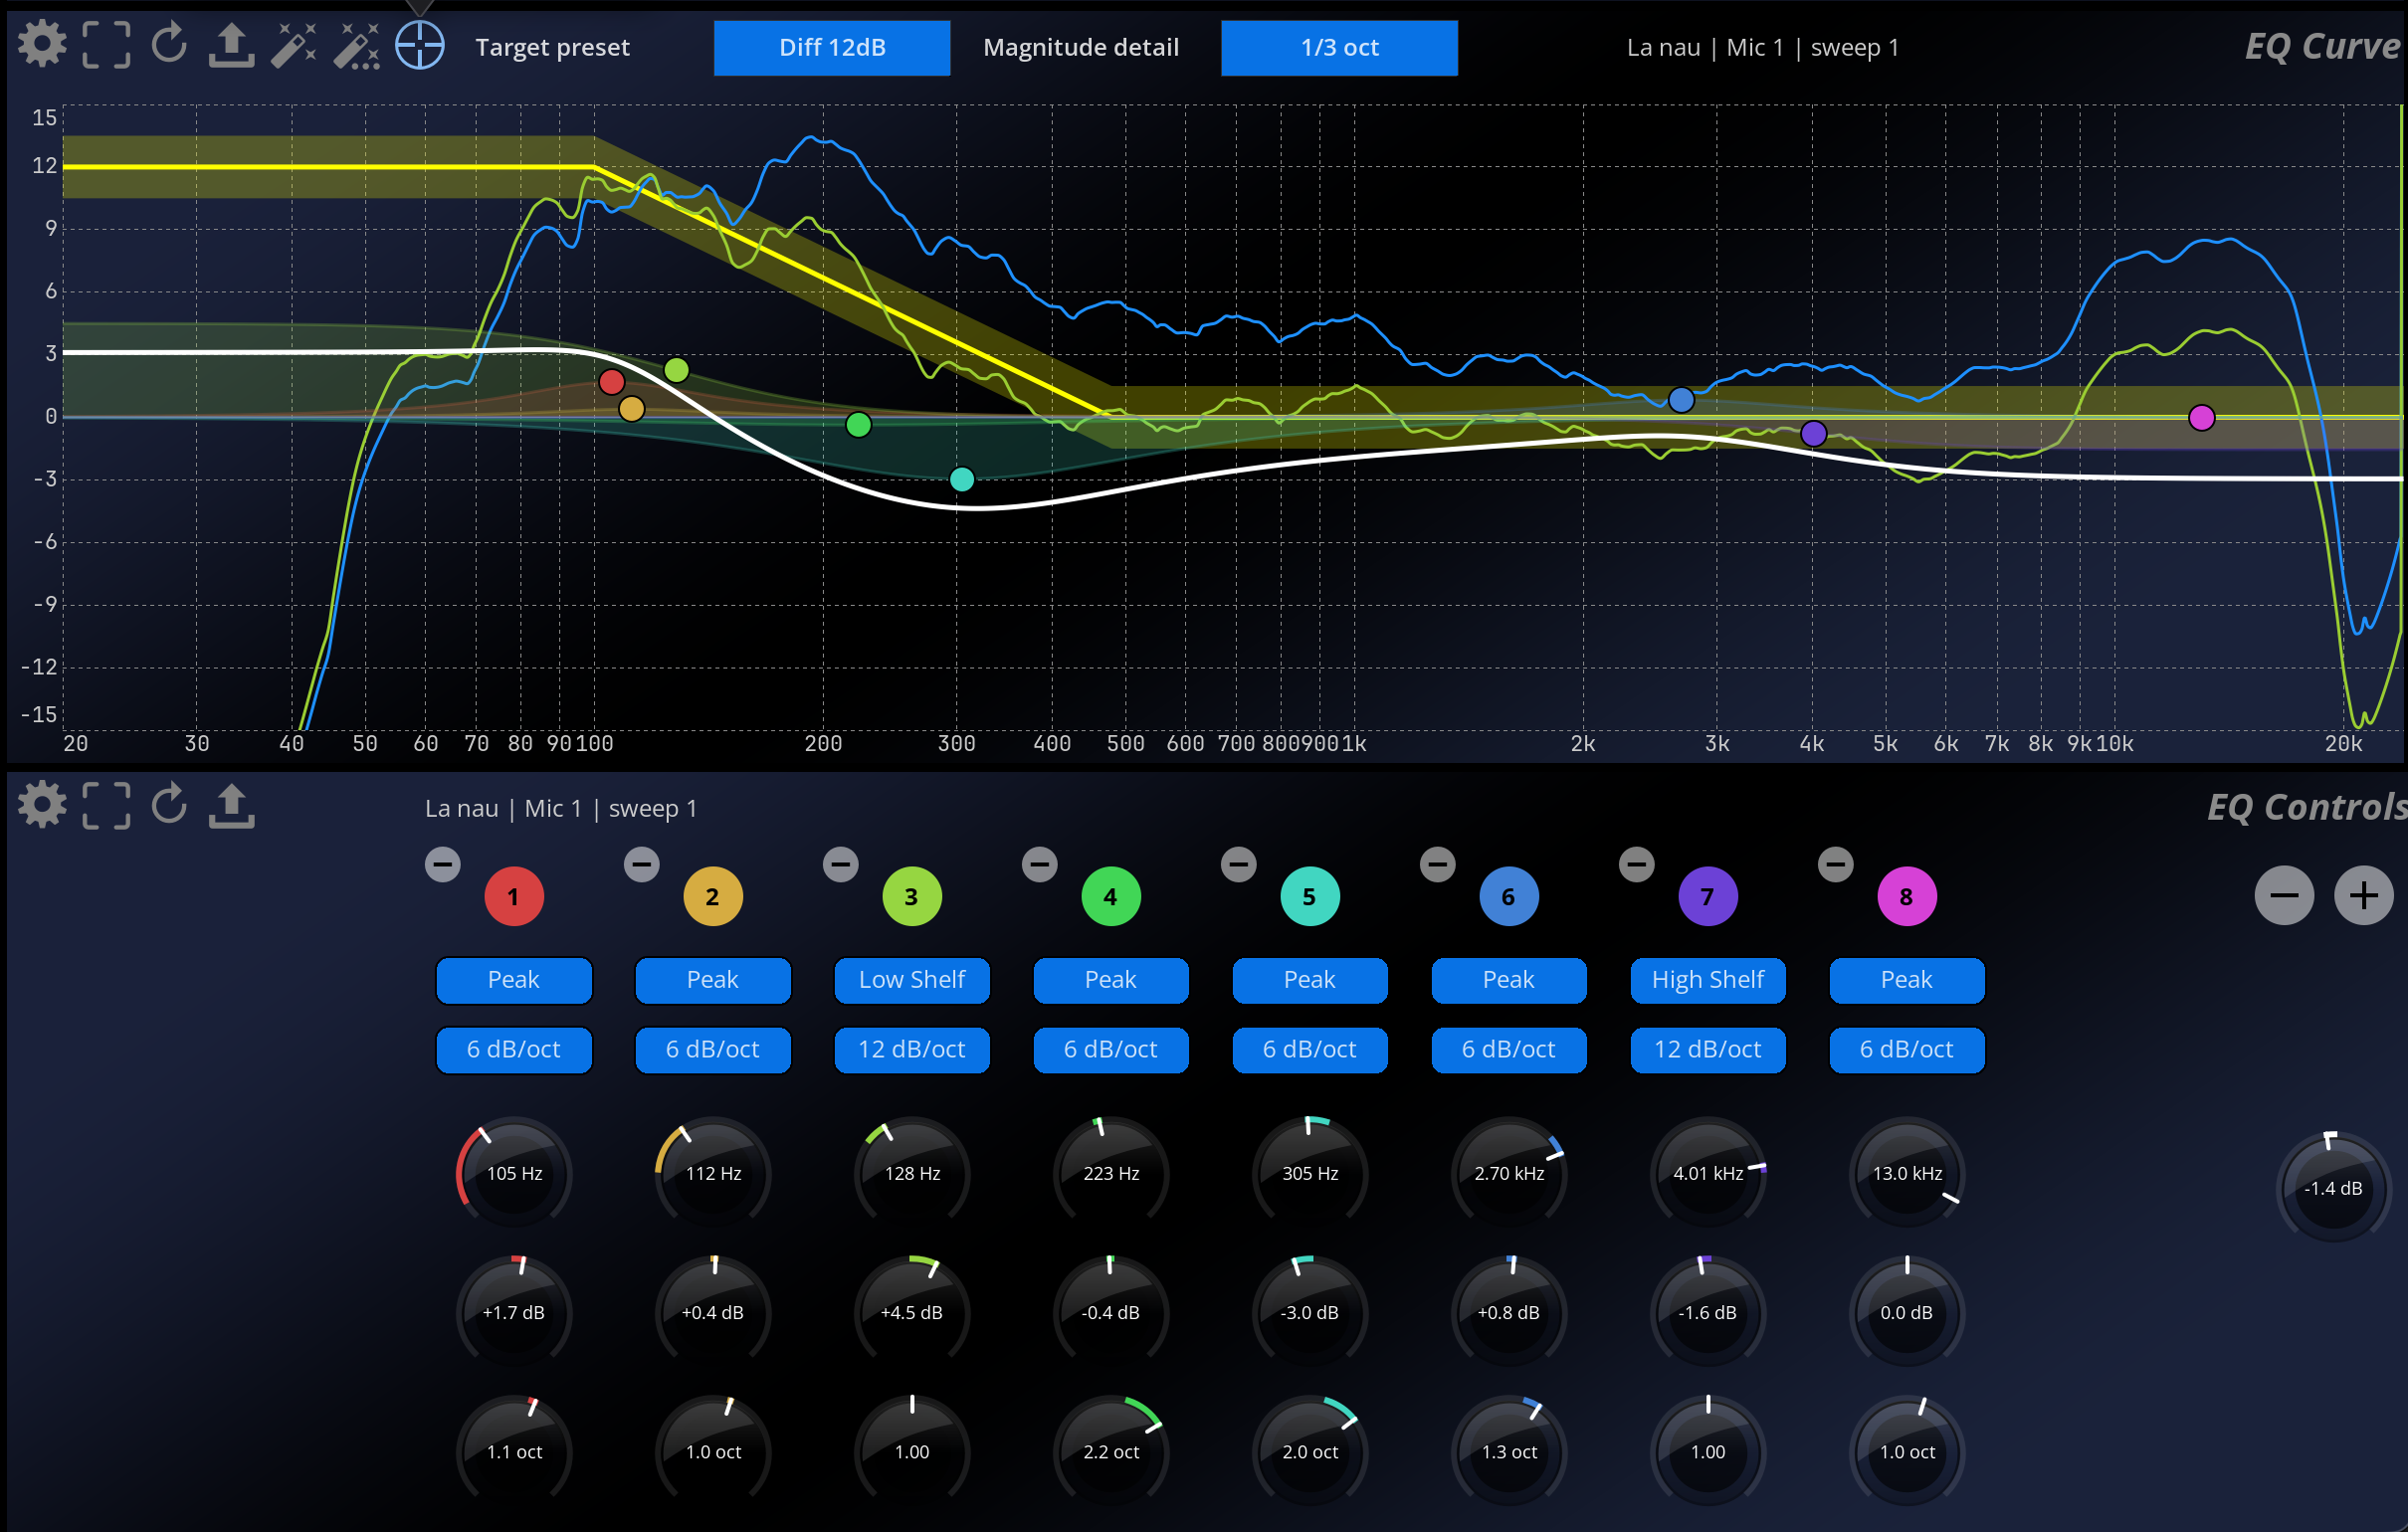
Each measurement capture includes an integrated EQ processor which comes with up to 16 bands. New EQs are initialized with 6 active bands. The EQ is applied to the transfer function measurement, generating an equalized version that can be displayed simultaneously with the original measurement for comparison, and will affect magnitude, phase and coherence. To display the equalized curve in the Transfer Function scope, enable the “EQ” field in the Captures scope. To display it in the EQ Curve and EQ Controls scopes, just select the capture in the Captures scope. In the EQ Curve scope, you can also show or hide the pre-EQ and post-EQ transfer function overlays independently.
Both original and equalized curves can be displayed simultaneously, the original curve being displayed grayed out.
Computed Curve Integration
MiRA supports computed curves that combine multiple captures. The EQ system integrates with computed curves as well as individual captures. In a computed curve, the EQ displayed can be drawn in 2 different ways:
- if the EQ is applied to a computed curve, the EQ curve will be displayed as a plain line.
- if the computed curve EQ is out-of-sync because one of its source captures has been edited, the EQ curve will be displayed as a dashed line.
Editing the EQ of a computed curve will automatically override the EQ of the individual captures that compose it.
When a capture’s EQ is modified, any computed curves using that capture are automatically recomputed and their computed-curve EQ is marked as out-of-sync to reflect the changes.
Filter Types
MiRA’s EQ supports multiple IIR filter types based on industry-standard implementations:
Filter Types
| Type | Description | Use Case |
|---|---|---|
| Low Pass | Attenuates frequencies above cutoff | High-frequency rolloff |
| High Pass | Attenuates frequencies below cutoff | Low-frequency rolloff |
| Band Pass | Passes frequencies within a band | Isolating frequency ranges |
| Notch | Attenuates frequencies within a band | Removing resonances |
| Low Shelf | Boosts/cuts frequencies below transition | Bass adjustment |
| High Shelf | Boosts/cuts frequencies above transition | Treble adjustment |
| Peak (Parametric) | Boosts/cuts frequencies around center frequency | Targeted corrections |
| Tilt Shelf | Boosts/ cuts above the frequency, do the invert below, with a shelf curve | Tonal balance corrections |
| Flat Tilt | Boosts/ cuts above the frequency, do the invert below, in a straight line | Tonal balance corrections |
Filter parameters
Each filter band can be configured with the following parameters:
| Parameter | Range | Description |
|---|---|---|
| Type | See above | Filter topology |
| Slope | 6-48 dB/octave | Filter order (availability according topology |
| Frequency | 5 Hz - 22 kHz | Center/cutoff frequency |
| Gain | ±24 dB | Boost/cut amount (for gain filters) |
| Q / Bandwidth / Resonance | Depends on unit | Filter selectivity. The parameter differs according to the filter topology. You can switch the bandwidth display unit between Octaves, Q (Standard), Q (Flux), and Q (FabFilter) in the EQ scope settings. |
| Enable | On/Off | Enable/disable a band clicking on the number of the band. |
FIR filters
FIR filters are not supported in the EQ system of MiRA.
Export capabilities
MiRA provides comprehensive export functionality to transfer EQ settings to external processors and systems.
Export formats
The export menu covers different workflows. Export is used to send the simulated correction to an external processor or another application.
| Format | Extension | Notes |
|---|---|---|
| Text / TOML - Parameters | .txt |
Human-readable filter parameters: type, frequency, gain, Q, slope, and related values. |
| Text / TOML - Coefficients | .txt |
Biquad coefficients for technical integration or verification. |
| LPIF - Compatible | .json |
LPIF-compatible export. When a filter cannot be represented directly, MiRA can export custom biquad data and warn the user. More information in the LPIF documentation. |
| LPIF - Extended | .json |
Extended LPIF/Harman export with additional information. More information in the LPIF documentation. |
| RME TotalMix FX Room EQ | .tmreq |
Export for TotalMix FX Room EQ. TotalMix supports 9 bands, delay, and output gain per stereo channel; unsupported filters or extra bands can be skipped with warnings. |
| FabFilter Pro-Q 4 | .ffp |
Export for FabFilter Pro-Q 4. MiRA maps supported filter shapes, slopes, Q, and gain values and warns if values are adjusted or bands cannot be represented. |
Depending on the destination format, MiRA may warn that some parameters were adjusted, some bands were skipped, or some filter types are not supported by the target.
Export workflow
To export the EQ settings, you need to:
- Configure the EQ on a capture or computed curve.
- Access the export function from the EQ view with the
 button, then choose the category and desired format.
 - Choose export location and filename.
- Import the file in the external processor.
Copy to SPAT Revolution workflow
When you need to reuse a MiRA correction in SPAT Revolution, use the EQ clipboard workflow instead of exporting a processor file:
- In MiRA, select the capture or computed curve whose EQ should be reused.
- Validate the EQ against the measured transfer function.
- Click the Copy button in the EQ Curve or EQ Controls header.
- In SPAT Revolution, open the target EQ editor for the relevant source, bus, room, or processor.
- Use Paste in the SPAT EQ editor.
- Recheck the destination EQ because unsupported bands, destination band limits, or different processing contexts can change the practical result.
Copying an EQ transfers filter settings; it does not transfer the MiRA measurement, target curve, coherence information, or Auto-EQ options. Keep the MiRA capture available for verification.
Screenshot needed: capture mira-eq-copy-to-spat.png.
Auto-EQ Integration
MiRA includes an Auto-EQ feature that automatically generates optimal EQ settings. The Auto-EQ algorithm analyzes the transfer function of an acoustic measurement and automatically calculates:
- A series of filters (peak, low-shelf, high-shelf)
- Optimal parameters for each filter (frequency, gain, Q / octave)
- An optional global gain
Auto-EQ runs asynchronously. During the computation, the EQ scope displays a processing overlay and editing is temporarily locked.
Auto-EQ is designed to work with transfer function measurements. Ensure you have captured a transfer function measurement before using this feature.
Getting Started
In the Live | system tuning | EQ ONLY layout of MiRA:
- In the capture scope, select a capture containing a transfer function measurement.
- Click the Auto-EQ options button in the header to display the controls.
- If needed, click the Target curve options and Transfer function options buttons to configure the target preset, target offset/tolerance, and smoothing detail.
- Configure the Auto-EQ options according to your needs: maximum number of bands and frequency range.
- Click the Auto-EQ button to start the computation.
- The computed equalization curve is displayed in the EQ curve scope and applied to the selected capture.
Settings
The Auto-EQ settings are displayed partly in the EQ curve scope header panels, and partly in the scope settings.
Main Parameters
These parameters are the most important ones to control the Auto-EQ process. The result will really depend on those settings.
| Name | Description |
|---|---|
| Number of bands | Maximum number of parametric filters to generate. Range: 1 to 16 bands. Default: 6. Start with 6-8 bands for general correction, increase for more precision, if your external processor allow a high number of bands. |
| Min frequency range | Minimum frequency to correct. Range: 5 Hz to 2000 Hz. Default: 80 Hz. Displayed as a draggable vertical line in the graph. In order to get a good result, exclude the frequencies bellow |
| Max frequency range | Maximum frequency to correct. Range: 200 Hz to 48000 Hz. Default: 18000 Hz. Displayed as a draggable vertical line in the graph. |
| Smoothing detail | Level of smoothing applied to the transfer function magnitude curve before computation. This parameter is available in the Transfer function options and also affects the Auto-EQ result. Use 2/3 or 1/2 octave for a good compromise. |
| Boost gain range | Maximum allowable gain for boost corrections. Range: 0 dB to +12 dB. Default: +6 dB. |
| Cut gain range | Minimum allowable gain for cut corrections. Range: -12 dB to 0 dB. Default: -6 dB. |
| Max Q range | Maximum allowable quality factor for filters. Range: 0.2 to 10.0. High values (>5) create very narrow filters; use with caution. |
| Global gain | Compute and apply an optimal global gain compensation. Default: enabled. |
| Gain resolution | Quantization step for generated gain values. Default: 0.5 dB. Use a coarser value when the destination processor has coarse gain steps. |
| Target offset | Vertical offset applied to the target curve before computation. Range: -12 dB to +12 dB. |
| Target tolerance | Visual tolerance zone around the target curve. Range: 0 dB to 6 dB. This is useful for judging the result but does not replace listening and measurement validation. |
Screenshot needed: capture mira-eq-auto-options.png, mira-eq-target-options.png, mira-eq-tf-options.png, and mira-eq-processing-overlay.png.
Target Curve
The target curve defines the desired frequency response after equalization. Click on the target icon  in the header to show/hide the target curve on the graph.
Presets
| Name | Description |
|---|---|
| Custom | Customizable curve with up to 10 points. Default points: 100 Hz (0 dB), 10000 Hz (0 dB). Double-click on the graph to add a point. |
| Flat | Flat curve (0 dB across the entire range). Objective: linear response |
| Diff 12dB | Acoustic diffusion curve. 100 Hz (+12 dB) → 1000 Hz (0 dB) |
| Diff 15dB | Acoustic diffusion curve. 100 Hz (+12 dB) → 1000 Hz (-3 dB) |
| Diff 18dB | Acoustic diffusion curve. 100 Hz (+12 dB) → 1000 Hz (-6 dB) |
| ISO X 2969 | ISO curve for cinema. Points: 20 Hz (-50 dB), 25 Hz (-3 dB), 30 Hz (0 dB), 2000 Hz (0 dB), 12500 Hz (-8 dB), 24000 Hz (-11 dB) |
| ISO X SUB | ISO curve for subwoofer. Optimized for low frequencies (10-300 Hz) |
| Dolby Atmos Music | Dolby Atmos Music target curve for immersive music monitoring. |
| Studio +/-1dB to +/-6dB | Studio tolerance curves. Studio +/-1dB: 20 Hz (+1 dB) → 48000 Hz (-1 dB) Studio +/-2dB: 20 Hz (+2 dB) → 48000 Hz (-2 dB) … up to +/-6dB |
Target Curve Parameters
| Name | Description |
|---|---|
| Offset | Vertical offset of the target curve. Range: -12 dB to +12 dB. Default: 0 dB. Use to adjust the overall level of the target and the Auto-EQ result. |
| Tolerance | Tolerance zone around the target curve. Range: 0 dB to 6 dB. Default: 0 dB in Auto-EQ options. This parameter is visual only and does not change the Auto-EQ computation. |
| Color | Display color of the target curve. Default: yellow. |
Recommended Workflow
1. Preparation
- Perform a quality transfer function measurement
- Verify that coherence is good (>0.8) in the frequency range of interest
- Display the EQ Curve view
2. Initial Configuration
- Show the Auto-EQ options and select the appropriate settings.
- Show the Target curve options and select an appropriate target curve preset.
- Show the Transfer function options and set the Smoothing detail to 2/3 or 1/2 octave, to get the contour of the capture and not all the fine details.
- Adjust the frequency range (Min/Max frequency range), accordingly to your system and your crossover frequency (if existing).
- Set the number of bands (6-8 to start). Keep some bands left for manual adjustment.
3. First Computation
- Click Auto-EQ
- Wait for computation (a few seconds)
- Examine the generated equalization curve
4. Refinement
- Adjust parameters if necessary:
- Increase the number of bands for more precision
- In the scope settings, reduce cut / boost gain ranges if correction is too aggressive, increase it if some filters are superposed at the same frequency.
- Modify the frequency range
- Rerun the computation
5. Validation
- Compare the before/after equalization curves
- Verify that corrections are reasonable
- Test with real audio content, on your system, after exporting the EQ parameters to your system.
Auto-EQ to external processor workflow
For processor export, choose Auto-EQ limits from the destination before calculating filters:
| Destination constraint | Auto-EQ setting to adjust | Practical guidance |
|---|---|---|
| Limited number of bands | Number of bands | Set MiRA to the destination band count or leave one or two bands free for manual changes. |
| Coarse gain steps | Gain resolution | Match the destination step size when known. |
| Limited boost capability | Boost gain range | Keep boost conservative; large boosts often indicate placement, crossover, or coverage issues. |
| Limited cut capability | Cut gain range | Keep cuts within the target processor’s range to avoid export adjustment warnings. |
| Narrow filters not supported | Max Q range | Reduce Max Q so generated filters are practical on the destination. |
| Correction should avoid crossover regions | Min/Max frequency range | Exclude regions that should be handled by crossover, alignment, or system design changes. |
| Overall level must stay unchanged | Global gain | Disable or review global gain before export if the destination gain structure is fixed. |
EQ scopes
MiRA features two scopes dedicated to EQ editing and visualization:
- EQ Curve - Displays the EQ curve and allows editing
- EQ Controls - Displays the EQ controls
The EQ Curve scope provides a dedicated interface for editing EQ curves. It displays the EQ curve and allows editing of filter parameters. The EQ Controls scope provides a list of all the filters of the selected capture or computed curve, and allows editing of filter parameters.
The EQ scopes are available in the Live and Ultimate version of MiRA only.
EQ curve (Live and Ultimate version only)
Controls
The EQ Curve header also provides output gain, add band, reset, export, copy, paste, undo, redo, Auto-EQ, target curve, and transfer function buttons. The Auto-EQ options, Target curve options, and Transfer function options panels are mutually exclusive, and the editable EQ curve is hidden while one of these panels is displayed.
| Name | Description |
|---|---|
| Target preset | Sets the target curve preset. Available presets include Flat, Diff 12/15/18dB, ISO X 2969, ISO X SUB, Dolby Atmos Music, Studio +/-1dB to +/-6dB, and Custom. Modifying a preset automatically switches to the Custom preset. |
| Magnitude detail | Sets the smoothing of the transfer function magnitude curve. This value is also used by the Auto-EQ algorithm. We advise to use “2/3 oct” or “octave” as default. This field is displayed in the Transfer function options. |
| Max bands | Sets the maximum number of bands used by the Auto-EQ algorithm. This field is displayed only when the Auto-EQ options are enabled. |
Settings
| Name | Description |
|---|---|
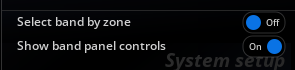
| Select band by zone | When enable, clicking in a graph will automatically select the nearest band. |
| Show band panel controls | Shows the band controls in the EQ curve direclty in the EQ curve scope. This is most usefull when displaying only EQ Curve scope without the EQ controls one. |
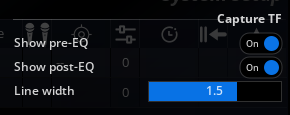
Capture TF
| Name | Description |
|---|---|
| Show pre-EQ | Shows the transfer function before applying the EQ. This EQ is grayed out. |
| Show post-EQ | Shows the transfer function after applying the EQ. |
| Line width | Sets the line width of the magnitude curve for both pre and post-EQ curves. |
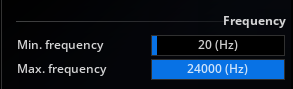
Frequency
| Name | Description |
|---|---|
| Min. Freq | Minimum frequency display by the transfer function. |
| Max. Freq | Maximum frequency display by the transfer function. |
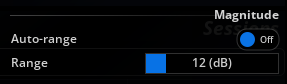
Magnitude
| Name | Description |
|---|---|
| Auto mode | Toggles auto-range on and off. When enabled, the display range automatically follows that of the transfer function magnitude curves, which is useful for hands-free operation, for example. Default is off. |
| Range | Minimum and maximum values to which the display is clamped, in decibels. |
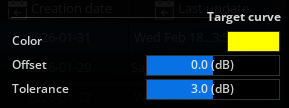
Target curve
| Name | Description |
|---|---|
| Color | Color of the target curve. |
| Offset | Gain offset of the target curve. Range: -12 dB to +12 dB. Default: 0 dB. Use to adjust the overall level of the target. |
| Tolerance | Tolerance zone around the target curve. Range: 0 dB to 6 dB. Default: 0 dB in Auto-EQ options. Defines an acceptable visual margin around the target. |
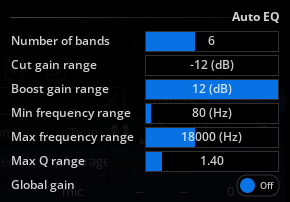
Auto EQ
| Name | Description |
|---|---|
| Max number of bands | Maximum number of parametric filters to generate. Range: 1 to 16 bands. Default: 6. Start with 6-8 bands for general correction, increase for more precision. |
| Cut gain range | Minimum allowable gain for cut corrections. Range: -12 dB to 0 dB. Default: -6 dB. |
| Boost gain range | Maximum allowable gain for boost corrections. Range: 0 dB to +12 dB. Default: +6 dB. |
| Min frequency range | Minimum frequency to correct. Range: 5 Hz to 2000 Hz. Default: 80 Hz. |
| Max frequency range | Maximum frequency to correct. Range: 200 Hz to 48000 Hz. Default: 18000 Hz. |
| Max Q range | Maximum allowable quality factor for filters. Range: 0.2 to 10.0. High values (>5) create very narrow filters; use with caution. |
| Gain resolution | Gain quantization step in dB. Default: 0.5 dB. |
| Global gain | Compute and apply an optimal global gain compensation. Default: enabled. |
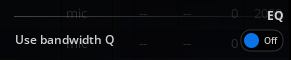
EQ
| Name | Description |
|---|---|
| Bandwidth unit | Select the bandwidth display unit: Octaves, Q (Standard), Q (Flux), or Q (FabFilter). |
EQ controls scope
Controls
The EQ Controls scope shares the common EQ header controls (output gain, add band, reset, export, copy, paste, undo, redo) and adds a dedicated Sort bands button.
| Name | Description |
|---|---|
 |
Reset the EQ |
|
Export the EQ. Several choices are available: - Text / TOML > Parameters - Text / TOML > Coefficients - LPIF > Compatible / Extended (more information in Export capabilities ) - Proprietary > RME | TotalMix FX Room EQ - Proprietary > FabFilter | Pro-Q 4 |
| Sort bands | Sort EQ bands by increasing frequency. |
Settings
| Name | Description |
|---|---|
| Bandwidth unit | Select the bandwidth display unit: Octaves, Q (Standard), Q (Flux), or Q (FabFilter). |